What is T Distribution?
T
distribution is the most famous theoretical probability distribution in
continuous family of distributions. T distribution is used in estimation where
normal distribution cannot be used to estimate population parameters. More
specifically T distribution is used in inference of a standardized
version of the sample mean when the sample size is very small i.e. less than 30
(even less than 5) and population standard
deviation is not known. However for making such inference using t distribution,
parent population distribution has to be normal. This t distribution is similar
to Normal distribution when few of its properties are compared.
Origin of T Distribution
The
t distribution is developed by famous statistician William Sealy Gosset. During
that period, Gosset used to work in Guinness Brewery; a company into business
of alcohol beverages. His employer did not allow him
or any of their staff to use their own names for publishing any scientific
papers. William Gosset used fictitious name ‘Student’ for publication of his
paper in Biometrika in year 1908. Hence the T distribution is called Student's
T distribution.
Why T Distribution?
Central
limit theorem plays important role in determining sampling distribution of any
statistic such as sample mean, sample proportion etc. if sample size large
enough. Sampling distribution of all such statistic follows normal
distribution. But if sample size is small,
and many times population standard deviation is not known to us. In such
situations, t distribution is of major help. T distribution uses sample size
and sample standard deviation in making inference about population mean.
Definition of T Distribution
T
distribution is
derived theoretically from standard normal distribution and chi square
distribution. Let us assume that we have independent standard normal variable Z
and variable U having chi square distribution with n degrees of freedom.
Z
and U are defined as follows:
Now T random variable is defined as:
This
T has n-1 degrees of freedom. This n can be any positive real number (n >
0), however only integer values of n are of importance.
Degrees
of freedom determines the shape of t distribution. There are many T
distributions for each degrees of freedom. This degrees of freedom is
simply number of independent numbers in given data set. T distribution when
used for estimating population mean using one sample with n number of
observations, degrees of freedom are n – 1. This is because if we have to find
mean of n observations, knowing n – 1 observations or their sum will eventually
give us last or nth number in data set. Therefore if we have sample of size 10
available for inference, we have to use 10 – 1 = 9 degrees of freedom.
Derivation of T score using this
definition is as follows:
Facts and Figures About T Distribution
Probability density function (PDF) of T distribution is given by,
Where,
n denotes degrees of freedom and Γ
denotes Gamma function.
Γ (n) = (n -1)!
Where, B (1/2, n/2) is Beta function
Probability Density Function
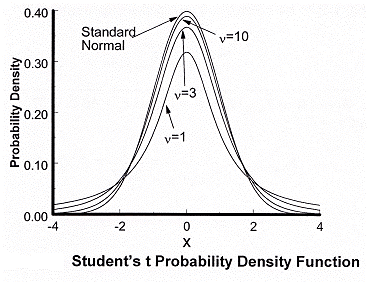
Probability Density Function Plot of
T Distribution
Cumulative Distribution Function
Cumulative distribution function
(CDF) is given by,
Here 2F1 is
hypergeometric function
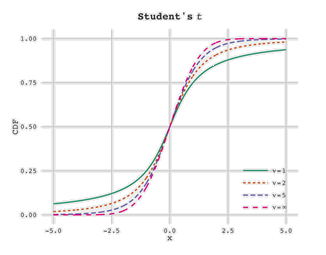
Cumulative distribution function
plot of T distribution
Measures of Central Tendency
Measures of central tendency of T
distribution are given below:
Mean = 0 for all n > 1
Mode = 0
It
shows that random variable t with n degrees of freedom is symmetrically
distributed around zero like normal distribution.
Variance and Standard Deviation
Variance
and Standard deviation of T distribution
Variance
of T distribution is , valid for n /n-2 > 2 only. It is not defined for any
other values.
Standard
deviation of t distribution is all the time larger than one. Hence comparison
of two probability density plots viz. standard normal distribution and t
distribution shows that t distribution has larger spread. This
comparison is shown in the following image.
Moments of T Distribution
All
odd order central moments are zero. Hence this distribution is symmetric around
zero.
Even
order central moments are given below:
When r = 1, μ2 = n /
(n-2)
When r = 2, μ4 = 3n2
/ ((n-2)*(n-4))
Skewness and Kurtosis
For T distribution, β1 =
0, γ1 = 0
Hence T distribution is symmetric or
mesokurtic.
γ2
= 6 / (n-4)
> 0
Hence T distribution is Leptokurtic
in nature.
Properties of T Distribution
- T distribution is symmetric
around zero and its shape resembles that of normal distribution.
- T distribution has support from
– infinity to infinity.
- T distribution changes as its
degrees of freedom changes.
- T distribution is unimodal.
- Area under t distribution curve
is 100% or 1.0 and the T curve never touches the horizontal line on either
side.
- T distribution curve increases
up to reaching zero i.e. from (-∞, 0) and then decreases from zero onwards
i.e. from (0, ∞).
- As sample size or degrees of
freedom for t distribution increases, the T distribution take up the normal
distribution.
- Random sample from T
distribution can be done by Monte Carlo Sampling method.
Relation
between t distribution and F distribution
T distribution and F distribution
are related to each other by the one
relation. If X follows t distribution with n degrees of freedom then X2 follows
F distribution with 1 and n degrees of freedom. i.e.
X ~ tn
then X2 ~ F (1,n)
If
a random variable follows T distribution with n degrees of freedom, then as n
→∞, the probability distribution of T distribution tends to standard normal
distribution.
Special Case of T Distribution
When T distribution has degrees of freedom (n) = 1, then the produced distribution is Cauchy distribution. Its PDF is given by,
Noncentral T Distribution
T
distribution has both central and noncentral forms which depends on
noncentrality parameter, δ. If this δ is zero, then the resulting distribution
is regular Student’s t distribution. However if this δ is not equal to
zero, resulting distribution is noncentral Student’s t distribution.
This noncentral t distribution is skewed distribution unlike central student’s
t distribution and it is skewed in direction of noncentrality parameter.
The
noncentral t distribution has n degrees of freedom
and noncentrality parameter δ and its form is as given below.
Multivariate T Distribution
Multivariate student’s T distribution is
generalization of univariate student’s t distribution. It has three parameters
viz. matrix of μ, covariance matrix Σ and degrees of freedom n.
Its PDF is given by,
Uses and Applications of T Distribution
T
distribution plays important role in inference theory where estimation of
unknown location parameter is done using Statistical T tests. T tests
are of different types. T tests (based on Student’s t distribution) are
preferred over Z tests (based on normal distribution) when population standard
deviation (σ) is not known and sample size is very small. In case sample size
is large (n > 30), we can use Normal distribution i.e. Z tests for inference
of population mean even if population standard deviation is not known based on
Central Limit Theorem.
There are certain assumptions which
must be satisfied if we want to use Student’s t tests. These assumptions
are listed below.
- All observations in given
sample must be independent of each other.
- Population from which sample is
drawn must have been normally distributed population.
- Standard deviation of
population distribution (σ) should not be known.
- Sample size used must be small
(n < 30).
- The hypothetical value is
correct value of population mean.
- All the sample observations are
correctly measured and recorded.
Hypothesis
testing and confidence interval
are equivalent forms in statistical inference. Types of statistical t tests and
corresponding confidence intervals are listed below:
Hypothesis Test for Single Population Mean
When
sample size (n) is small and population standard deviation (σ) is not given, we
can use one sample T test for determining significance of population mean.
Brief steps for this T test are described below:
Hypothesis to be tested:
Null Hypothesis: µ = µ0
Alternative Hypothesis: µ ≠ µ0
(It can be ≠ or > or < depending upon direction of Research hypothesis)
Rejection Rule: Reject the null
hypothesis if test statistic (t) falls in rejection region.
Formula for confidence interval for
mean (µ) is given below:
Hypothesis Test for Difference between two Independent
Population Means
When
we have to compare two samples drawn from independent populations, and when
both population’s variances are not known, we can use independent samples T tests.
There are two types for this independent sample t test.
Independent
samples T test assuming unknown but equal population variances
Hypothesis to be tested:
Null Hypothesis: µ1 = µ2
Alternative Hypothesis: µ1
≠ µ2
Where Sp is pooled
estimate for standard deviation and it is calculated as follows:
Rejection
rule: Reject the null hypothesis if test statistic (t) falls in rejection
region.
Formula
for confidence interval for difference in means when population standard
deviations are unknown and equal is given below:
Independent
samples T test assuming unknown and unequal population variances
Hypothesis to be tested:
Null Hypothesis: µ1 = µ2
Alternative Hypothesis: µ1
≠ µ2
The
degree of freedom is given by, DF 
Rejection Rule: Reject the null
hypothesis if test statistic (t) falls in rejection region.
Formula for confidence interval for
difference in means µ1
- µ2 when population standard deviations are unknown and
unequal is given below:
Hypothesis Test for Difference Between two Dependent Population
Means
When we have to compare two samples
drawn from dependent populations, we can use dependent samples T tests. It is
also known as repeated measures T test or paired T test.
Hypothesis to be tested:
Null Hypothesis: µd = 0
Alternative Hypothesis: µd
≠ 0
Where
standard deviation of  is
given by formula
Rejection Rule: Reject the null
hypothesis if test
statistic (T) falls in rejection region.
Formula for confidence interval for
paired difference is given below:
Hypothesis Test for Linear Correlation Coefficient
When we have to determine
significance of linear correlation coefficient, test based on t distribution is
used as follows.
Hypothesis to be tested:
Null Hypothesis: ρ = 0
Where r denotes sample correlation
coefficient.
Rejection Rule: Reject the null
hypothesis if test statistic (t) falls in rejection region.
Rejection Regions and Critical Values for T
Distribution
Critical
values for t statistic are calculated using cumulative probabilities.
Critical value with 5% level of significance is denoted as t0.05.
These values depends on whether test is right tailed, left tailed or two
tailed. Also since T distribution is symmetric, critical value to the
right side of distribution with specific alpha, is equal to critical value to
the left side of distribution. For example two critical values corresponding to
10 degrees of freedom and 5% level of significance are t0.05,10 =
1.812 and t0.95,10 = -1.812.
Rejection Region Curves for one Tailed and Two Tailed Tests:
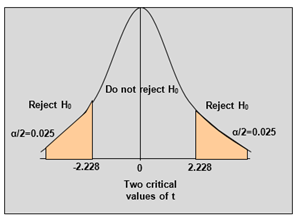
- Rejection region for two
tailed hypothesis test showing critical values for given level of
significance (α = 0.05) and degrees of freedom 10 is shown below.
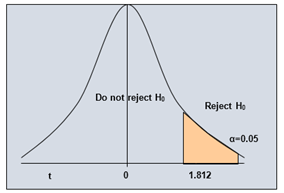
- Rejection region for right tailed
hypothesis test showing critical values for given level of significance (α
= 0.05) and degrees of freedom 10 is shown below.
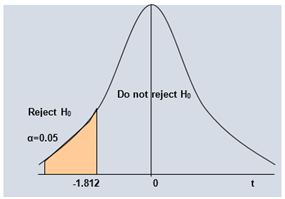
- Rejection region for left
tailed hypothesis test showing critical values for given level of significance
(α = 0.05) and degrees of freedom 10 is shown below.
Comparison of critical values for
different t distributions shown below suggests that as degrees of freedom
increases, curve approaches to bell shaped normal curve.
These
critical values for t distribution can be calculated in Excel, Minitab, SPSS, R
or any other statistical package very easily.
T
distribution in Excel
To
determine T critical values using Excel, use function:
TINV(probability,deg_freedom)
It
gives critical value for the probability associated with the two-tailed
Student's T-distribution and corresponding degrees of freedom.
To
determine p value, use function in Excel:
TDIST(x,deg_freedom,tails)
It
gives p value for the numeric value at which we want to evaluate the
distribution for given degrees of freedom and one tailed or two tailed test.
T
distribution in R
can be calculated by using command:
dt(x,
df, ncp, log = FALSE)
T
distribution in SAS can
be calculated by using command:
probt(t-statistic, df)
T Distribution Table
T distribution table is given below:
This
T table can be used for given alpha from row 1 and row 2 based on one tailed
and two tailed test for corresponding degrees of freedom.
T Distribution Calculators
There
are various calculators available online which gives these T critical
values, computes T test statistic and solves these T tests online similar to
statistical packages. We need to input values as per required formats in these
calculator
T
distribution in Bayesian inference:
In
Bayesian inference, posterior distribution of any unknown parameter is
estimated by using prior distribution and likelihood of given data. T
distribution is the posterior distribution for unknown mean μ of normally
distributed population when conjugate prior is used. In general prior for
normal distribution when used together with chi square distribution prior for
variance part, T distribution arises as marginal
distribution for μ.
T
distribution can also be used in robust parametric modelling in
substituting normal distribution when normal distribution is inappropriate.
More
Readings
If you need more help in t-distribution-homework-help
Click here


